
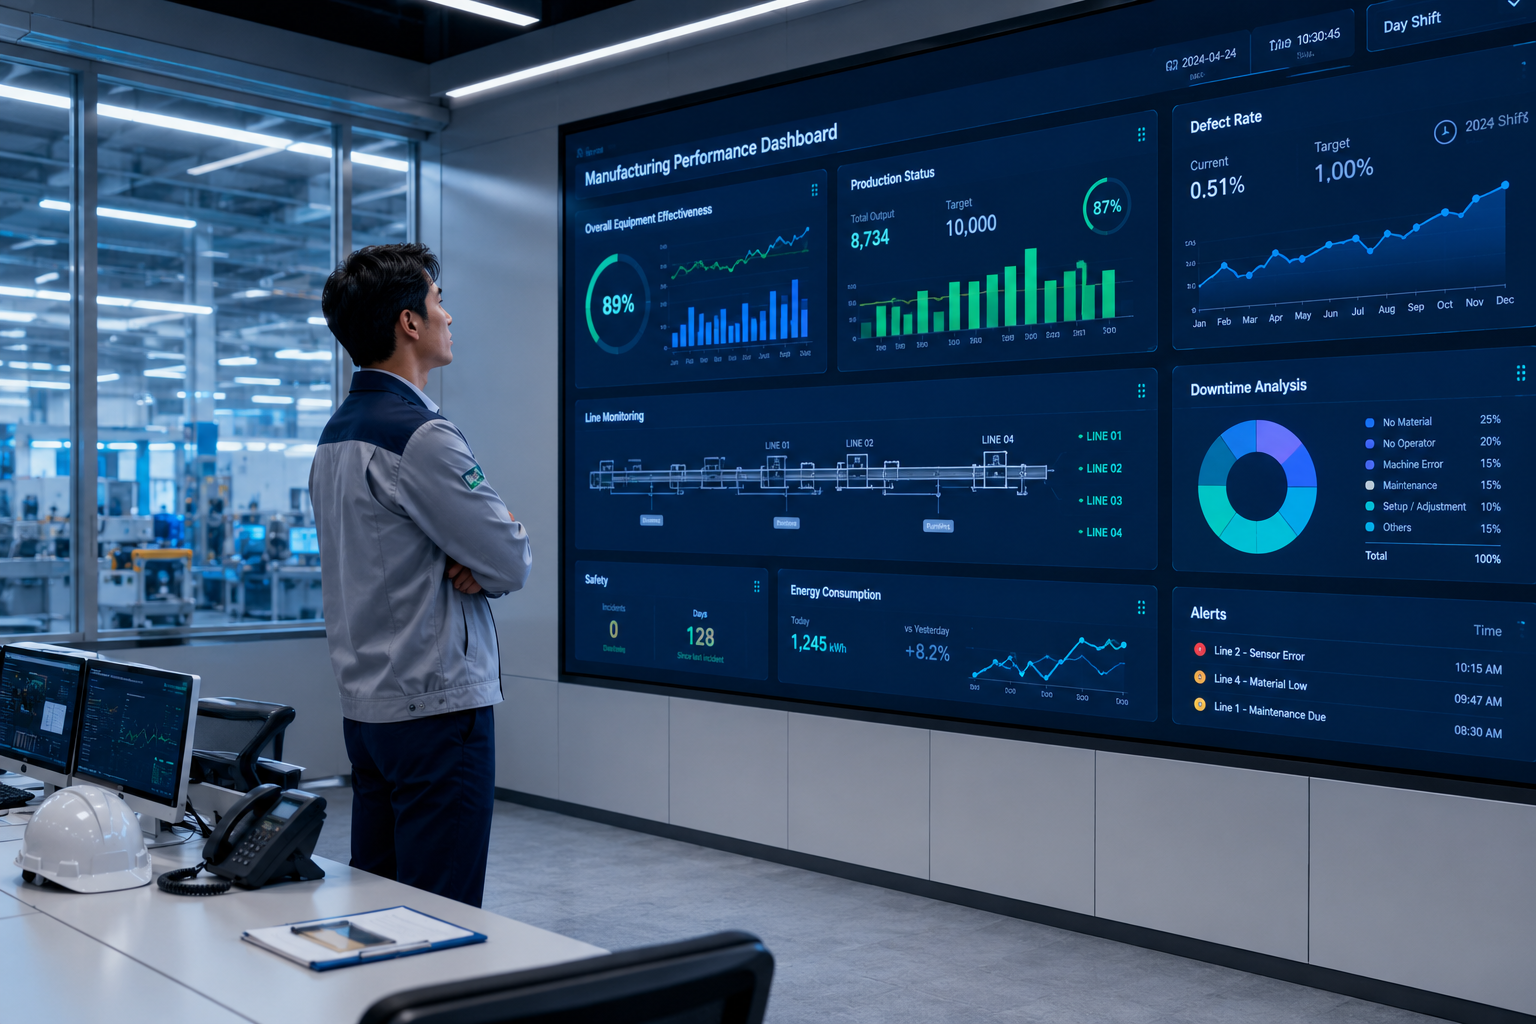
In modern manufacturing, relying on end-of-the-day paper reports is no longer enough to maintain high standards. To truly control your production line, you need a Power BI defect monitoring dashboard.
Connecting your Quality Lab directly to your factory’s data systems allows quality managers to visualize issues the exact moment they happen. Here is a practical guide on how to transform your quality operations with real-time data integration.
1. Why Manufacturing Needs Real-Time Monitoring
Relying on manual Excel sheets for quality control is risky. By the time a quality engineer compiles the data, an entire lot of defective products might have already passed through the line.
- The Advantage: A live dashboard spots trends instantly. It shifts your quality management strategy from reactive troubleshooting to proactive defect prevention.
2. Extracting Data from Your Factory Systems
The foundation of any good dashboard is reliable data. You must first secure the correct database access from your IT department to pull real-time manufacturing metrics, whether from an ERP or a manufacturing execution system.
- Key Data Points: You need to extract specific tables from the server. Focus on retrieving data regarding Lot Numbers, Defect Codes, Inspection Timestamps, and Production Shifts. Clean and structured data is critical before importing it into Power BI.
3. Building the Power BI Defect Monitoring Dashboard
Once your data is connected, the design of your dashboard should focus on clarity and speed. A cluttered screen is useless to a busy quality inspector.
- Visualizing the Data: Use a Line Chart to track the overall defect rate by hour. Use a Pareto Chart (80/20 rule) to highlight the top three defect causes of the day. This allows the team to prioritize their problem-solving efforts immediately.
4. Tracking Yield and Quality Metrics
When manufacturing complex products, tracking specific failure modes is crucial for maintaining high yield rates.
- Practical Application: Your dashboard should filter data by specific product lines and shifts (e.g., day shift vs. night shift). If a specific dimensional defect or assembly error spikes during the night shift, the dashboard will immediately highlight this anomaly for the morning management review.
5. Empowering Your Quality Lab Team
A data system is only effective if the team actually uses it. The final step is making this data highly visible and accessible to the engineers on the floor.
- The Setup: Mount a large display screen directly inside the Quality Lab showing the live Power BI dashboard. Set up automated email alerts for management if the defect rate exceeds the control limit. This ensures everyone is aligned and accountable.
By integrating production data into a visual dashboard, you give your quality team the ultimate tool to reduce waste, improve efficiency, and guarantee product excellence.